Market summary
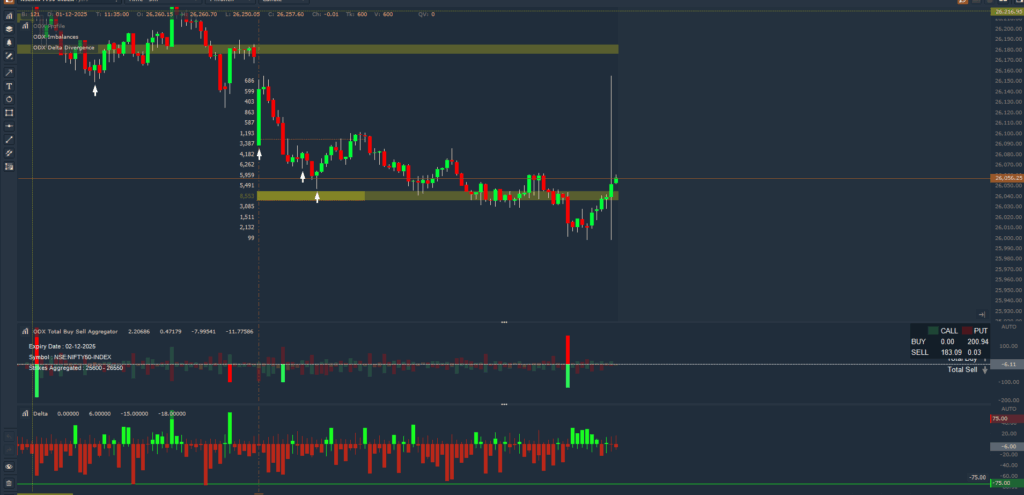
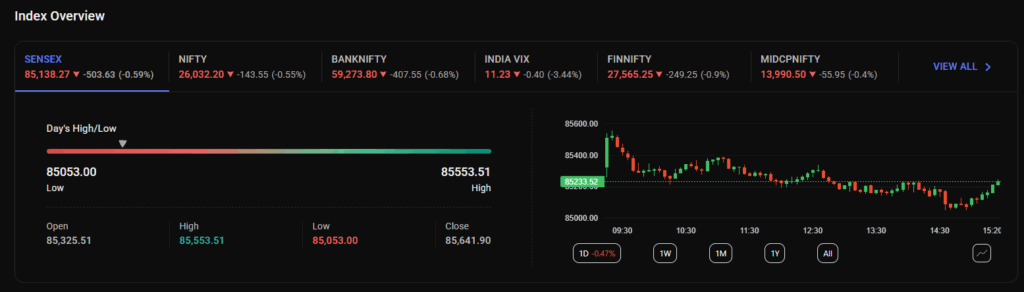
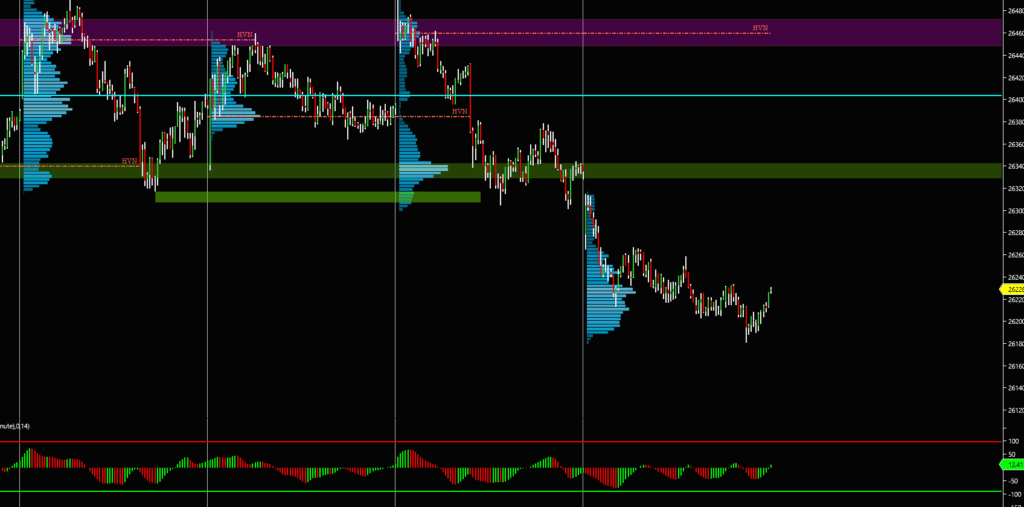
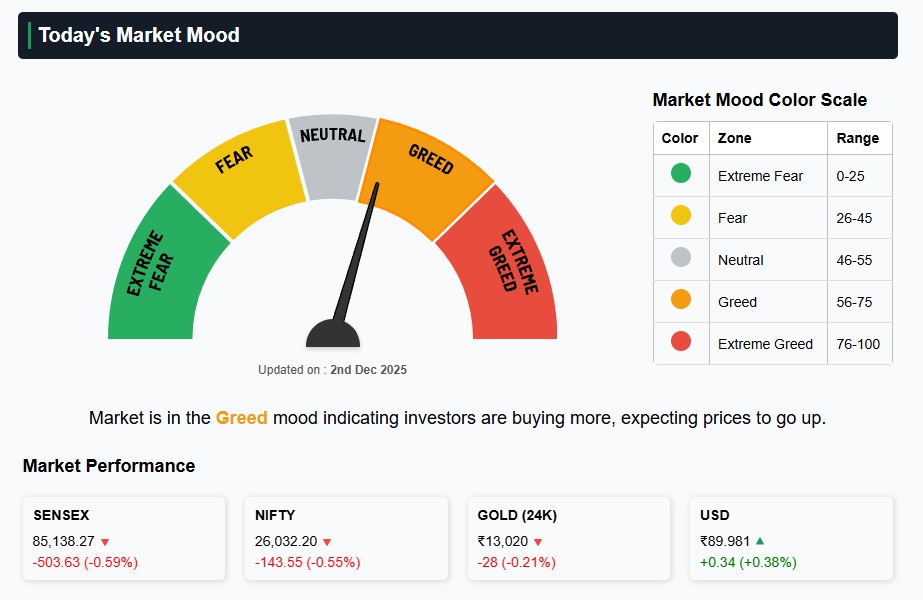
Nifty opened with a sharp gap down of 87.80 points at 26,087.95, tried to recover toward 26,154.60, but selling pressure dragged it down to 25,997.85 before closing at 26,032.20, a fall of 143.55 points (-0.55%). In the first 5 minutes, a strong delta divergence appeared: the range‑bound ratio of 51 signalled that buyers were getting trapped even though price was not breaking out, a classic sign of smart money selling into early optimism.
By 9:45 am, delta had turned heavily negative at -97,275, confirming aggressive selling absorption and shifting intraday control fully to the bears. Later at 2:40 pm, a very large sell order flow hit the tape, but the candle still closed above POC, which indicates buyer presence at lower levels and is the main reason the market stopped falling for the day instead of collapsing far below 26,000.
India VIX eased by 3.44% to 11.23, which looks calm on the surface but can be deceptive on expiry days: realised intraday swings were meaningful, but options were already pricing in lower future volatility, hurting late option buyers.
Why the market fell this much
- Gap‑down sentiment and trapped buyers
- The gap down itself showed that overnight positioning was wrong‑footed; expectations from GIFT Nifty positivity turned into disappointment as cash market opened weak.
- Buyers tried to defend the initial sell‑off, but delta divergence in the first 5 minutes plus heavy negative delta at 9:45 am made it clear that institutions were using every bounce to sell, not to build fresh longs.
- 26000 as a magnet and risk trigger
- 26,000 has been a key structural support in the recent swing; once price moved towards it on expiry, it acted like a magnet, pulling the index lower as option sellers adjusted and hedged.
- Intraday break below 26,000 (low 25,997.85) triggered fear and stop‑losses, but late buying around POC 26,050 managed to pull the close slightly above this level, leaving the support “damaged but not yet destroyed”.
- Macro undercurrent: rupee risk, oil and global caution
- Hedging against rupee weakness has become more expensive as markets price the risk of 90/USD, which typically makes foreign investors cautious on Indian equities and increases hedging cost for import‑heavy sectors.
- Headlines about India’s Russian oil imports and shifting crude flows add uncertainty around input costs and current account dynamics, leading to selective profit‑booking.
- Gold falling on profit‑booking along with rising US Treasury yields reflects a global de‑risking and repositioning phase, which often spills over into emerging markets like India and fuels intraday selling on indices.
Overall, the fall is a combination of expiry‑day positioning, heavy negative delta, aggressive selling into bounces, and a fragile global–macro backdrop where currency risk is back in focus.
Bonus point – trading discipline
Your key trading message stands strong for readers:
- Do not make decisions purely from GIFT Nifty and YouTube pre‑market commentary; let the market open, watch the first 15–30 minutes, and then trade based on real chart structure and order flow.
- On expiry days, avoid averaging into long positions because theta decay accelerates losses; a 2‑rupee option going to 200 is almost a lottery‑level event, with probability near zero.
- Never carry naked overnight positions in such conditions; use defined‑risk spreads, hedged futures, or reduced position size if you must carry.
Technical points
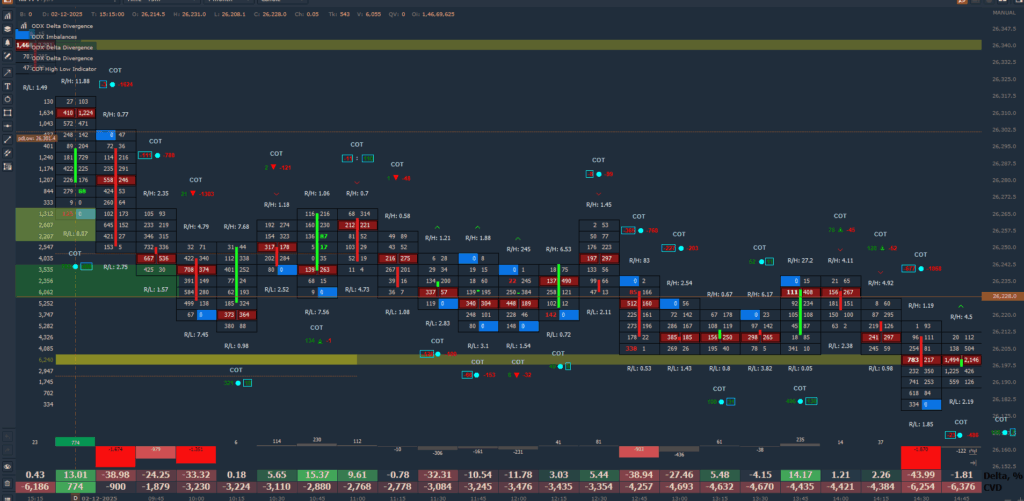
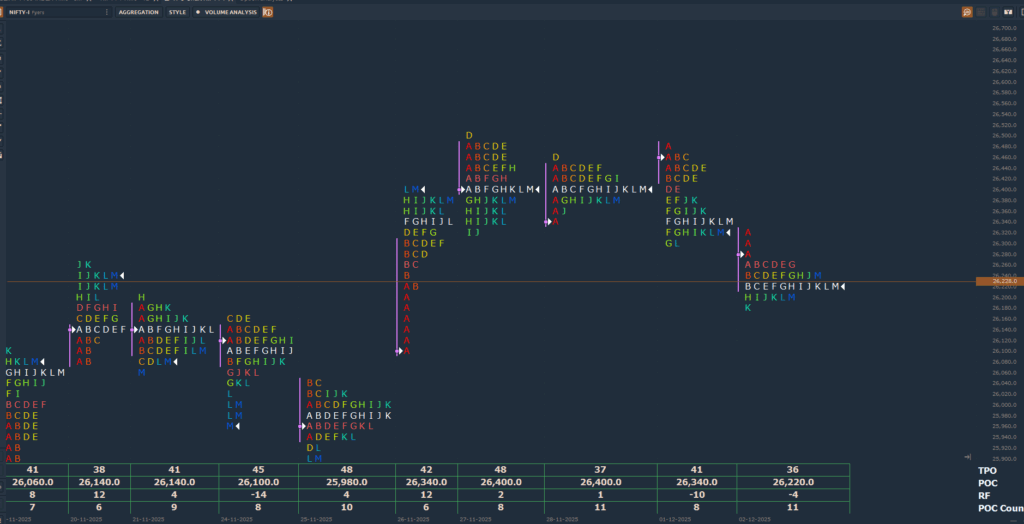
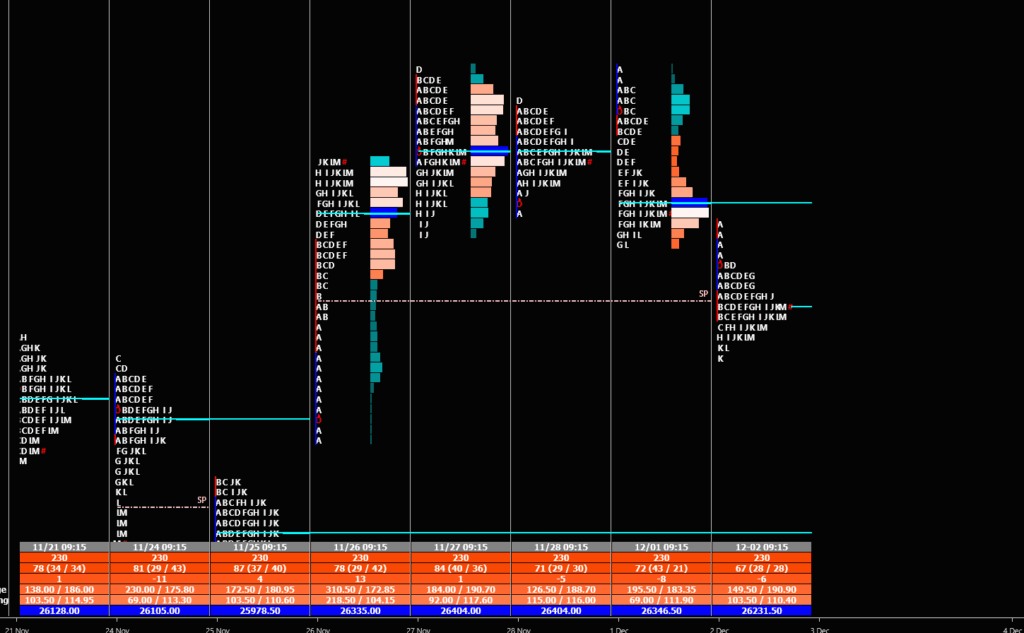
- Today’s POC: 26,050 – this is the intraday “fair value” area where the most business was done and where buyers finally managed to stop the fall.
- Rotation factor: -6 – indicates a bearish, down‑rotational day with multiple pushes lower rather than balanced two‑way auction.
- POC count: 11 – shows repeated tests and acceptance around this key zone, making 26,050–26,000 the battleground for the next few sessions.
Price closing just above 26,000, with a negative rotation factor and strong intraday selling, means the level is technically weak: any fresh negative news or follow‑through selling can lead to a clean breakdown below 26,000.
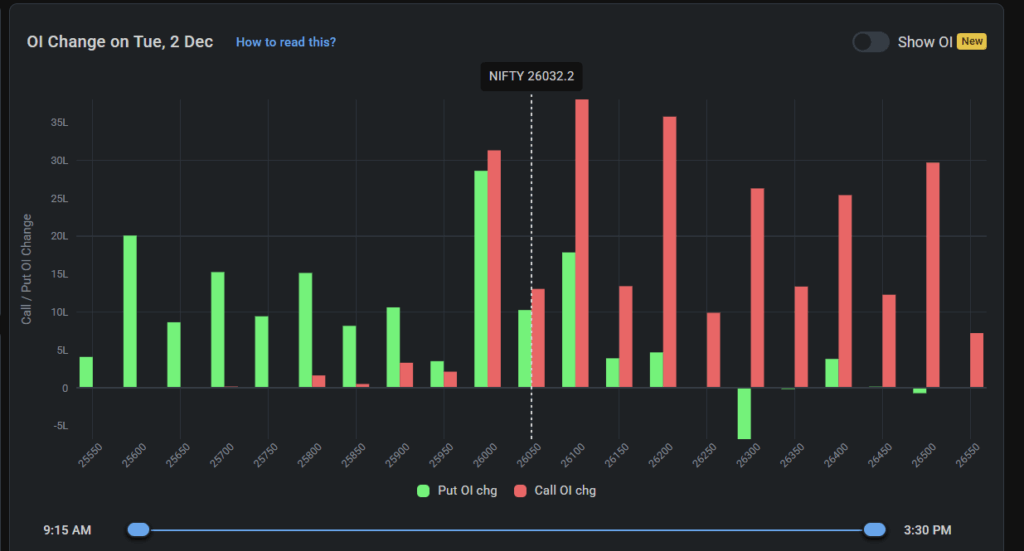
Open interest for 09 December expiry
- Highest Call OI: 26,050
- Highest Put OI: 26,000
- Highest change in OI:
- Call OI increased at 26,100
- Put OI increased at 26,000
This structure tells a clear story:
- Call writers are active slightly above spot (26,050–26,100), trying to cap the upside and earning from time decay if Nifty stays below those strikes.
- Put writers are still defending 26,000, but the fact that price has already tested below and bounced weakly makes this defence vulnerable.
- If 26,000 breaks convincingly on a closing basis, aggressive unwinding of put writing plus fresh short build‑up can accelerate downside.
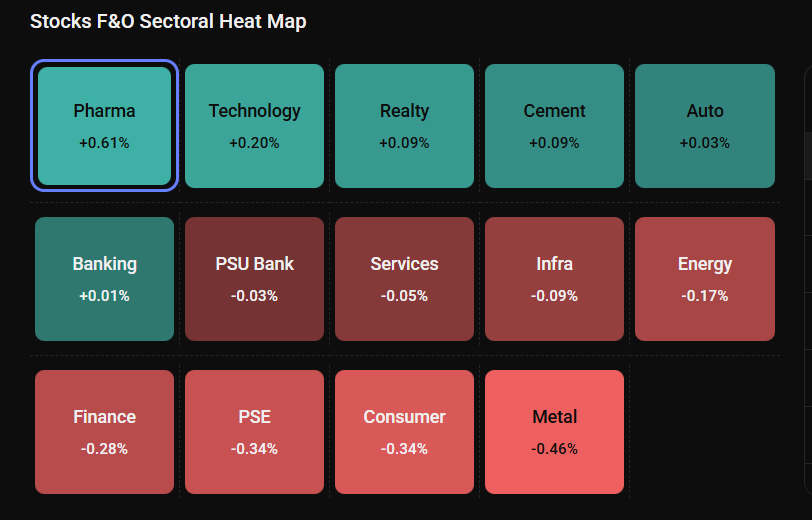
Sectoral movement
- Pharma was the main gainer, benefiting from a defensive bid as traders rotated into traditionally safer sectors during index weakness.
- Metals led the losers, reflecting concerns around global demand, commodity price swings, and currency‑linked cost pressures.
This defensive rotation confirms that while the broader trend might still be structurally positive on higher timeframes, short‑term sentiment is cautious and selective.
Global news context
- The Kremlin describing the decline in India’s Russian oil imports as temporary keeps the energy narrative fluid; any change in sourcing or discounts can impact margins for oil‑intensive industries.
- Hedging against rupee weakness becoming costlier as 90/USD looms is a strong macro headwind; higher hedge cost tightens financial conditions for corporates and pushes FIIs to be more tactical.
- Gold falling as investors book profits while US Treasury yields rise signals re‑allocation into higher‑yielding dollar assets, typically negative for risk assets in emerging markets.
These macro elements don’t directly “cause” the intraday candle, but they create the background against which institutions choose to sell rallies, especially near major supports like 26,000.
Additional points
- Today’s expiry shows how quickly sentiment flips: from the idea that “26,000 is safe” to “26,000 is in serious danger” within a single session; this is why rigid bullish or bearish bias is risky in expiry weeks.
- For upcoming sessions, 26,000–25,900 becomes a must‑hold demand zone; a sustainable close below this region can open room to 25,800–25,700, while any strong bounce with short covering needs confirmation above 26,100–26,150.
- For options traders, favour defined‑risk structures (credit spreads, iron flies/iron condors around key OI strikes) over naked selling, and keep a close eye on how 26,000 put OI behaves on any further test of that level.
Disclaimer
This analysis is purely for educational purposes and is not investment advice. You are not SEBI registered, and readers should consult their own SEBI‑registered financial advisor before making any trading or investment decisions. There is no association with any broker or platform; any P&L or screenshots shared are only to reduce negativity around options trading and to show how options can be used for risk management, not to sell courses or guarantee profits.
Comments are closed